|
M5 Control Panel |
|
This section explains the basic functionality of the M5 Control Panel application. As described in the Overview section, the M5 Control Panel is an application with a user-interface that connects to a M5 Monitor Service running on the local PC or a remote PC available on the network. When the program is first launched, the user is prompted to connect to a computer running the M5 Monitor Service (Figure 6). Previous connections are preserved in a drop-down list.

Figure 6. M5 Control Panel prompt to connect to an M5 Monitor Service instance.
Enter localhost into this dialog to connect to an M5 Monitor Service running on the same machine as the M5 Control Panel. To connect to an M5 Monitor Service running on a remote machine on the same network, enter the machine name or network IP address instead. Once connected, the M5 Control Panel allows a user to view the current status and interact with an M5 Monitor Service.
When connecting to M5 Monitor Service, M5 Control Panel verifies the compatibility of transceiver support between the two systems and may indicate one or the other has limited support. Some features, such as editing configuration or sending remote commands may be disabled. To correct this situation, make sure both M5 Control Panel and M5 Monitor Service are updated to the latest software version.
A custom desktop shortcut can be created to always connect to a specific machine (including localhost) instead of having the Connect to M5 Service prompt display each time. Create a new shortcut on the desktop to the M5ControlPanel.exe file (located in C:\Program Files\PTAGIS\M5\M5 Control Panel) and select Properties from the context menu. Select the Shortcut tab of the Properties dialog and at the end of the Target field, enter -s {name of machine or localhost} as shown in Figure 7 below. Save the changes and, optionally provide a more meaningful name to the modified shortcut by right-clicking it again and selecting Rename.
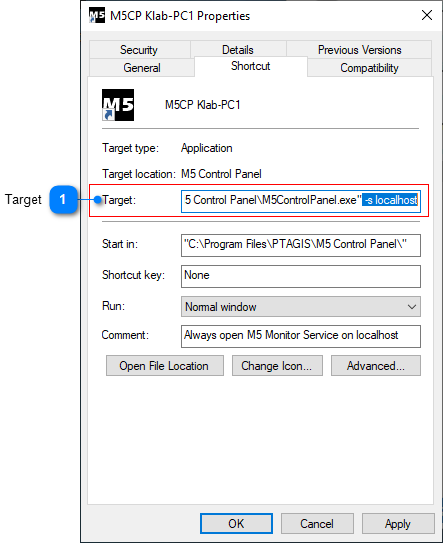
Figure 7. Modified shortcut to M5 Control Panel to always open the M5 Monitor Service on localhost.
The user interface (Figure 8) is divided into 4 sections, described here top-to-bottom:
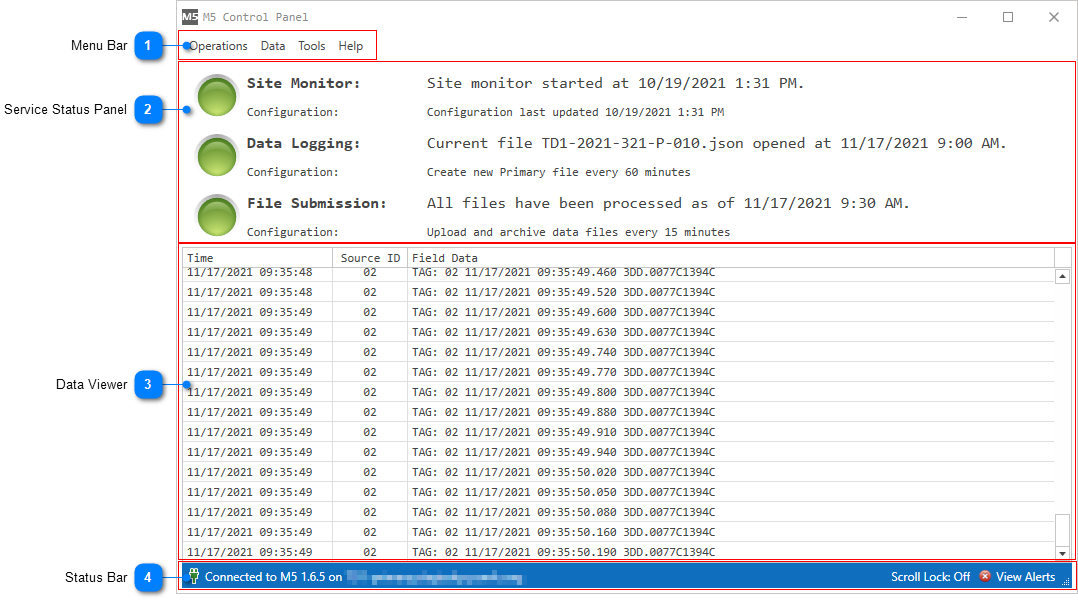
Figure 8. M5 Control panel user interface.
|
Provides features to interact with the connected M5 Monitor Service. |
|
Presents real-time status of the site monitoring services described in the Overview section. The color of the status light represents the state of each subservice: •Gray: stopped •Yellow: transitioning between states •Green: running optimally •Red: faulted; associated alert indicator displayed in the Status Bar |
|
Data Viewer |
|
|
Displays real-time data feed from the site. The data feel only displays a limited number of items starting when first connected and replacing older items when newer ones are generated. Timestamps are rounded to the nearest second and are associated with local time of the connected system running M5 Monitor Service. |
|
Status Bar |
|
|
Provides connection status, alerts indicator, and the status of the Data Viewer scroll lock feature. If the M5 Monitor Service is submitting Test Data Only, a message to that effect will also be displayed here. |